One brief, six setups: a bake-off of ways to run Claude Code
Abstract
On 29 September 2026 I gave one brief to six ways of running Claude Code: build a generative, interactive page in vanilla JavaScript. Setup A used the agent prompts of Odoo Launchpad, the Odoo hosting control plane I built with Claude agents; the others were plain Claude Code, gstack, ECC, a multi-agent workflow and an agent team. Each run had its own sandbox, Claude Code 2.1.284, Opus 5.5 and a $25 cap. The workflow ran twice, headless and interactive, so there were seven runs, and I measured them from their transcripts and a headless browser. The headless workflow built nothing. The other six pages worked with no errors and no outside requests, and five of them are Physarum slime-mold simulations. They cost from $2.33 to $10.64. When I broke code on purpose, all four test suites caught a broken simulation core, and only A's and C's caught broken pointer input, in both cases outside the default test command.
The question
I built Odoo Launchpad, a control plane for hosting Odoo businesses, between July and August 2026, almost entirely with Claude agents. It had its own pipeline of agent prompts: a spec drafter, an initializer, and coder sessions that worked through a checklist. Most of its specs were built outside that pipeline, in Claude Code sessions I steered directly. I wanted to know how the pipeline compared with other ways of running Claude Code on a task it had never seen. So I gave one brief to six setups, ran each one in a sandbox, and measured what it did and what it shipped.
The development model I drew from Launchpad’s defect record cites these results, and the Launchpad essay describes that model.
Method
Conditions
Every run received the same brief and its own empty git repository. All of them used Claude Code 2.1.284 with Opus 5.5, auto permission mode and a $25 cap, inside a macOS sandbox-exec fence with a fake home directory that blocked SSH keys, credentials and the other runs’ folders. Approval gates had standing approval, and each run logged the questions it would have asked a person.
The brief was this:
Build a cool generative, algorithmic, interactive page in vanilla JavaScript. No frameworks, no libraries, no build step. Make it something you would be proud to show.
The six setups
| Run | Setup | How it ran |
|---|---|---|
| A | Launchpad’s prompts | Launchpad’s real agents/*.md prompts, composed the way its pipeline composes them: a spec drafter, an initializer, then fresh coder sessions until the checklist was done |
| B | Plain Claude Code | the brief and nothing else |
| C | Claude Code with gstack | installed by its own setup; /office-hours, /autoplan, build, /review, /qa, /ship |
| D | Claude Code with ECC | installed from its pinned checkout; the orch-pipeline flow: planner agent, test-driven development, reviewer agents |
| E | Workflow, headless | claude -p writing and running its own multi-agent workflow |
| E2 | Workflow, interactive | the same setup in a real terminal session driven by expect |
| F | Agent team | a lead plus simulation, interface and testing teammates, run interactively because teams don’t form under claude -p |
A is Launchpad’s pipeline, which the repository calls “this repository’s method”: the same prompts that drove Launchpad’s agents, given an empty repository and the brief.
E and E2 are one setup run two ways. Each run wrote its own workflow, so the two differ: E’s had five phases (Ideate, Judge, Build, Review, Polish) and E2’s had six (Concept, Judge, Build, Review, Fix, Verify). The repository’s write-up counts them the same way: six setups in seven runs.
What I measured
These are the measures. Except for the break-checks, which ran each run’s own test suite, they come from the transcripts or from a headless browser.
- Cost in US dollars. E2 and F ran interactively, so their costs are estimates from the transcripts, with per-token rates fitted to the headless runs’ own reported costs (within about 7%).
- Minutes of wall-clock time. The runs shared one machine at the same time, so these are approximate.
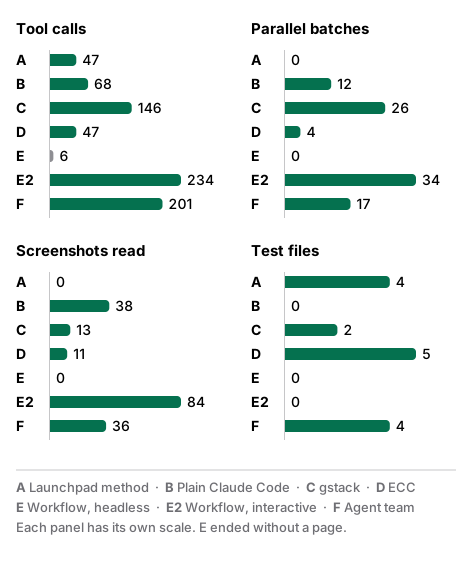
- Process counts from the transcripts: tool calls, parallel batches of tool calls, screenshots the agent read, commits and test files.
- Break-checks for two guards in each run, the simulation core and pointer input. I broke the line on purpose, and the run’s own test suite had to fail. Launchpad’s
scripts/break-check.shdoes this: it applies one literal replacement that must match exactly once, requires the suite to exit non-zero with at least onenot okline, restores the file from a byte snapshot and requires the suite to pass again. Exit 0 means the guard is real, 1 means the break didn’t make the suite fail, and 2 means a problem in the check itself. - Reduced-motion ratio: motion with
prefers-reduced-motiondivided by normal motion after settling. A ratio of 0 means the page stops moving, and above 1 means it moves more than without the setting. - Errors and requests in a headless browser: console errors, page errors and requests outside the page’s origin.
Results
What shipped
Six of the seven runs shipped a page. E’s workflow stopped when its headless session ended: it built nothing, exited with status 0, and its repository holds only the seeded empty commit.
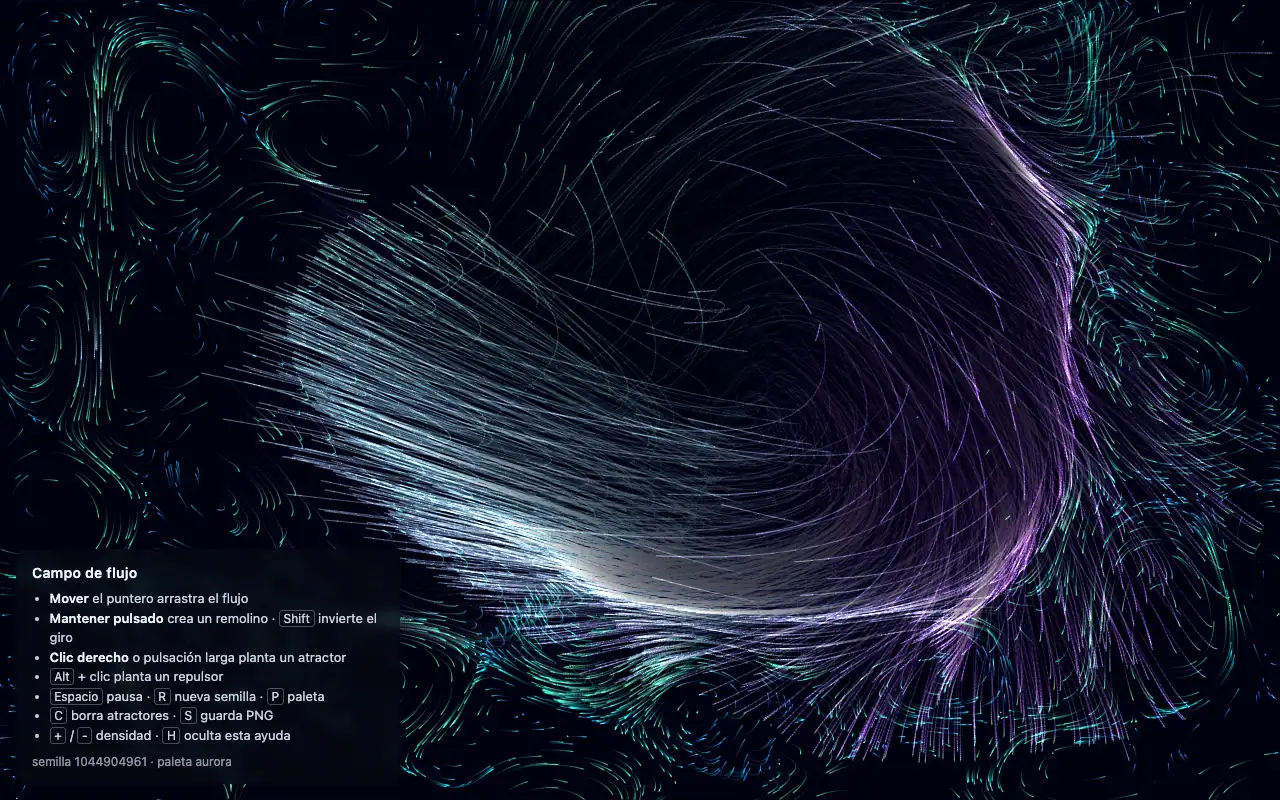
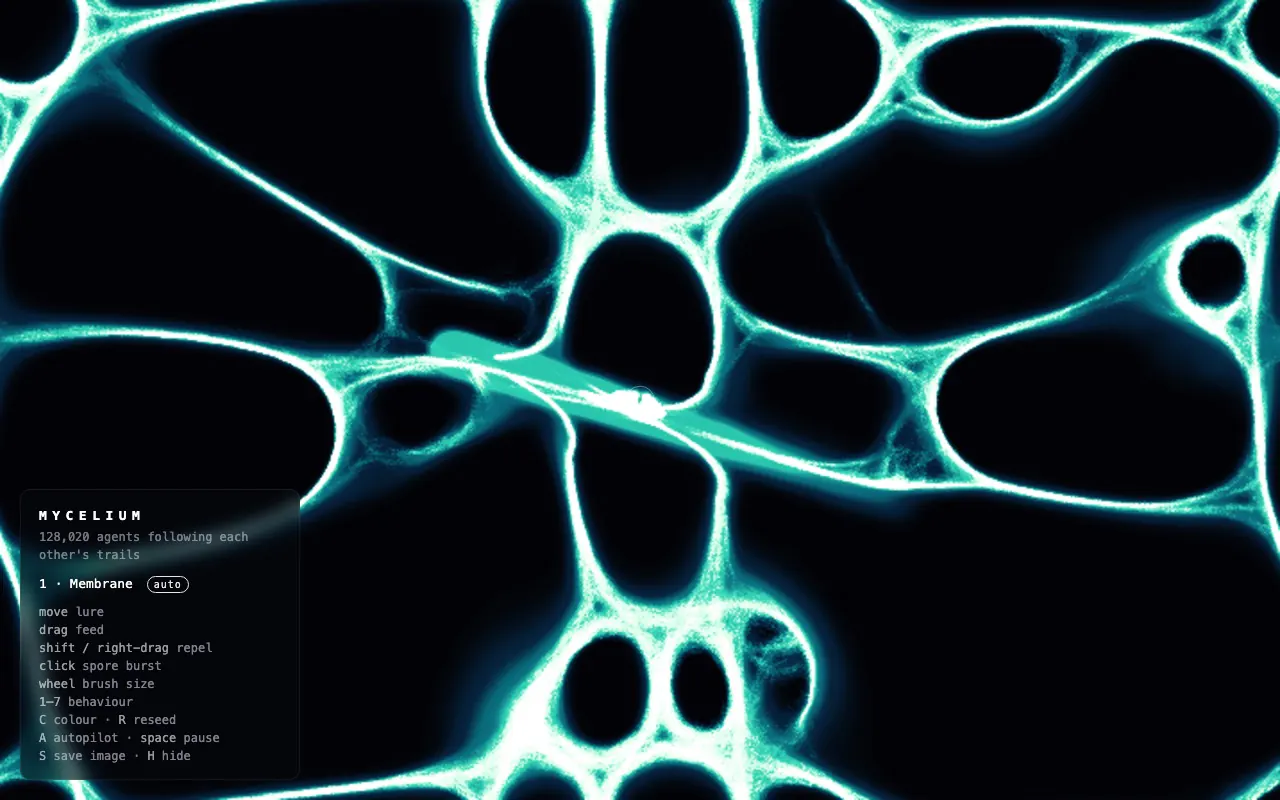
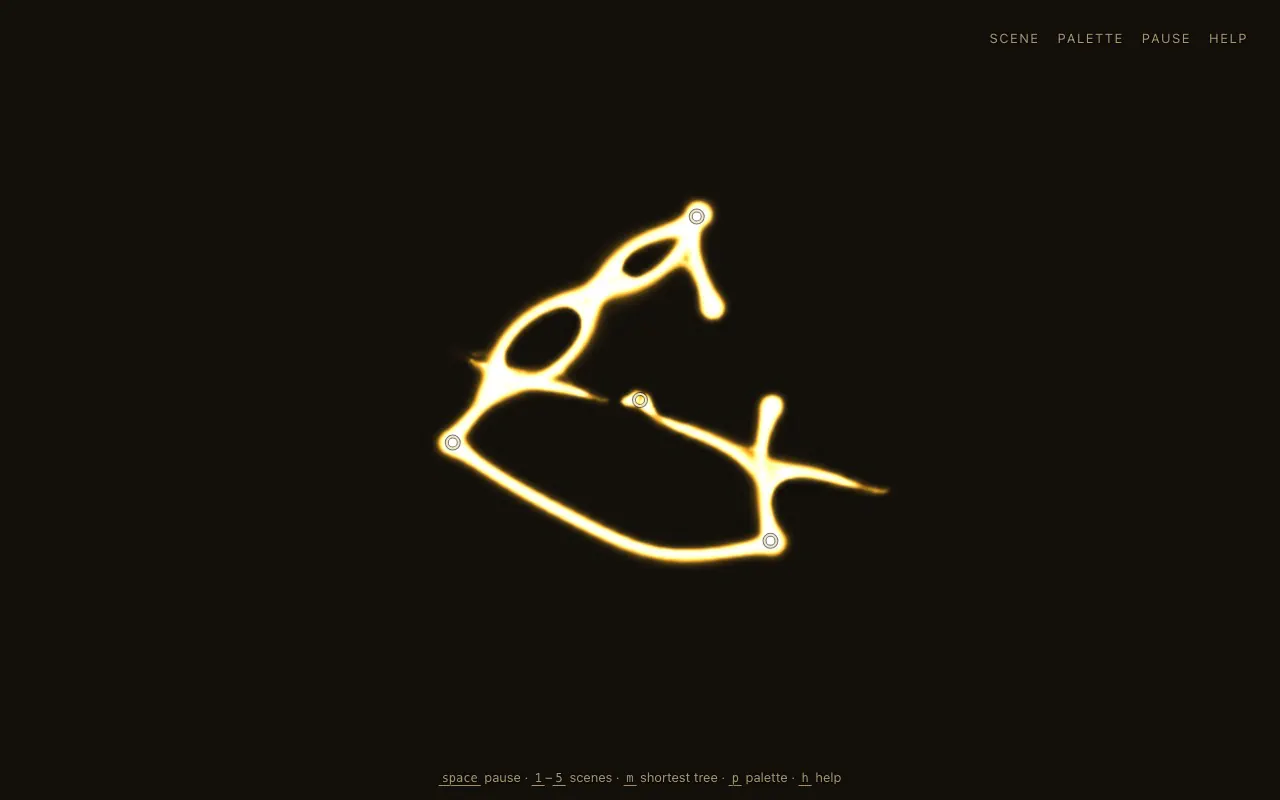
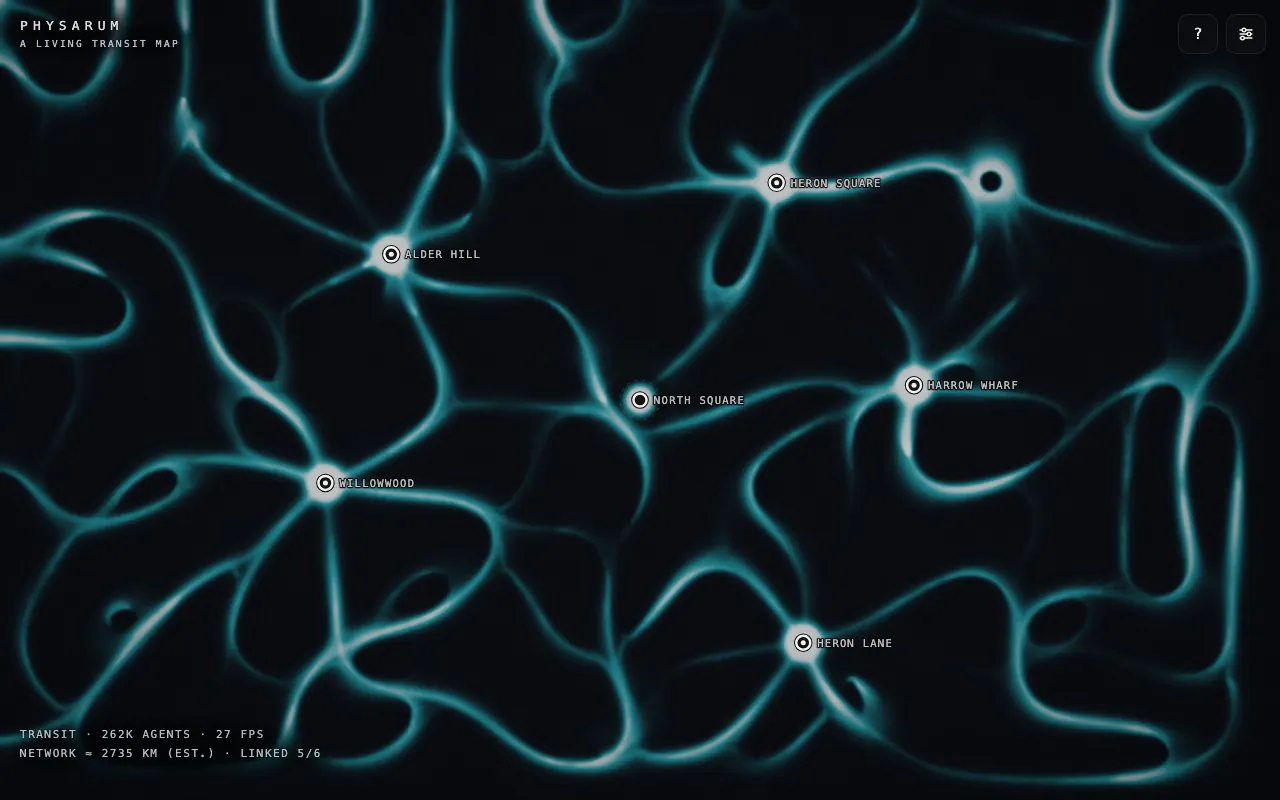
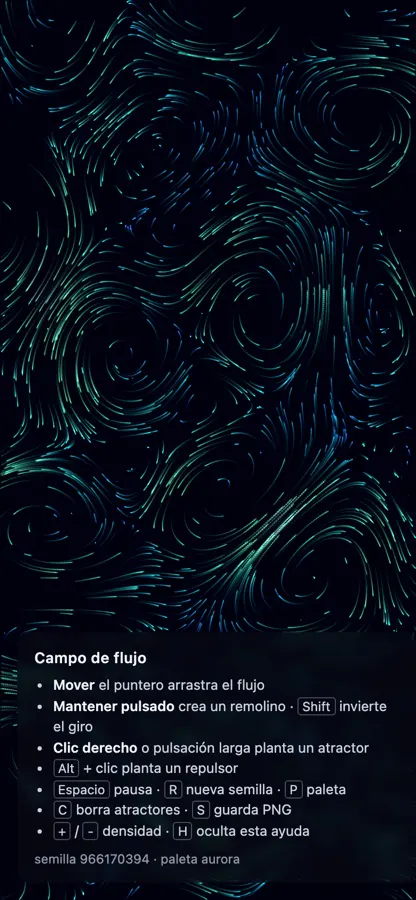
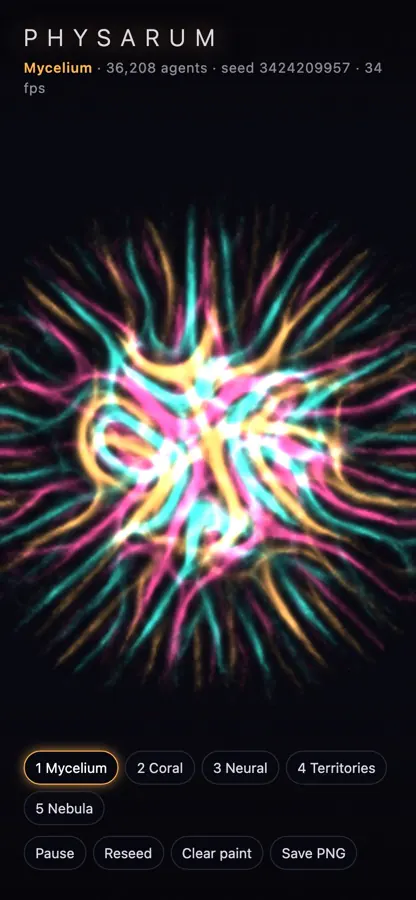
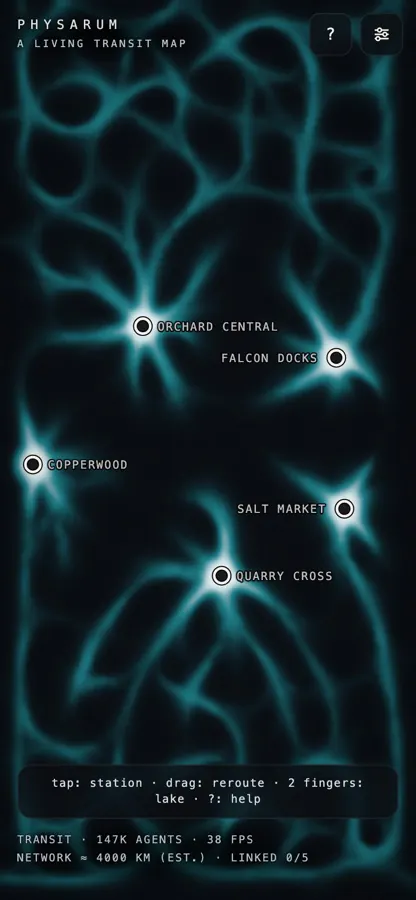
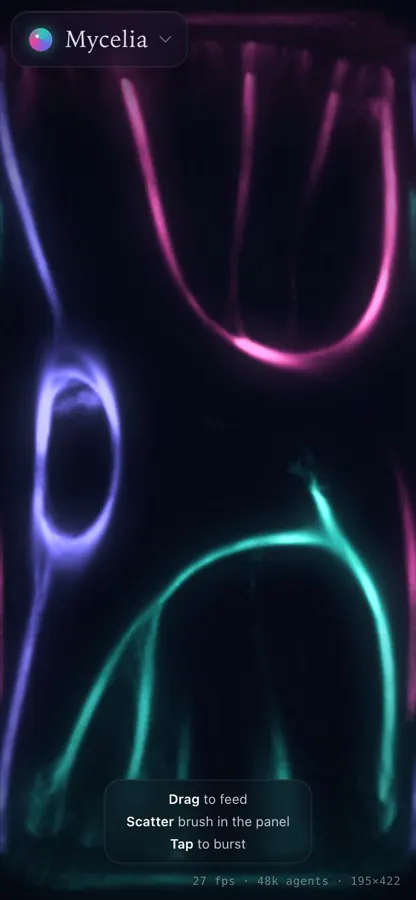
Five of the six pages are the same idea, a Physarum slime-mold simulation based on Jeff Jones’s 2010 agent model. A, the run that used Launchpad’s prompts, built a flow field: particles that follow a time-varying curl-noise field, which the pointer bends with swirls, attractors and repulsors.

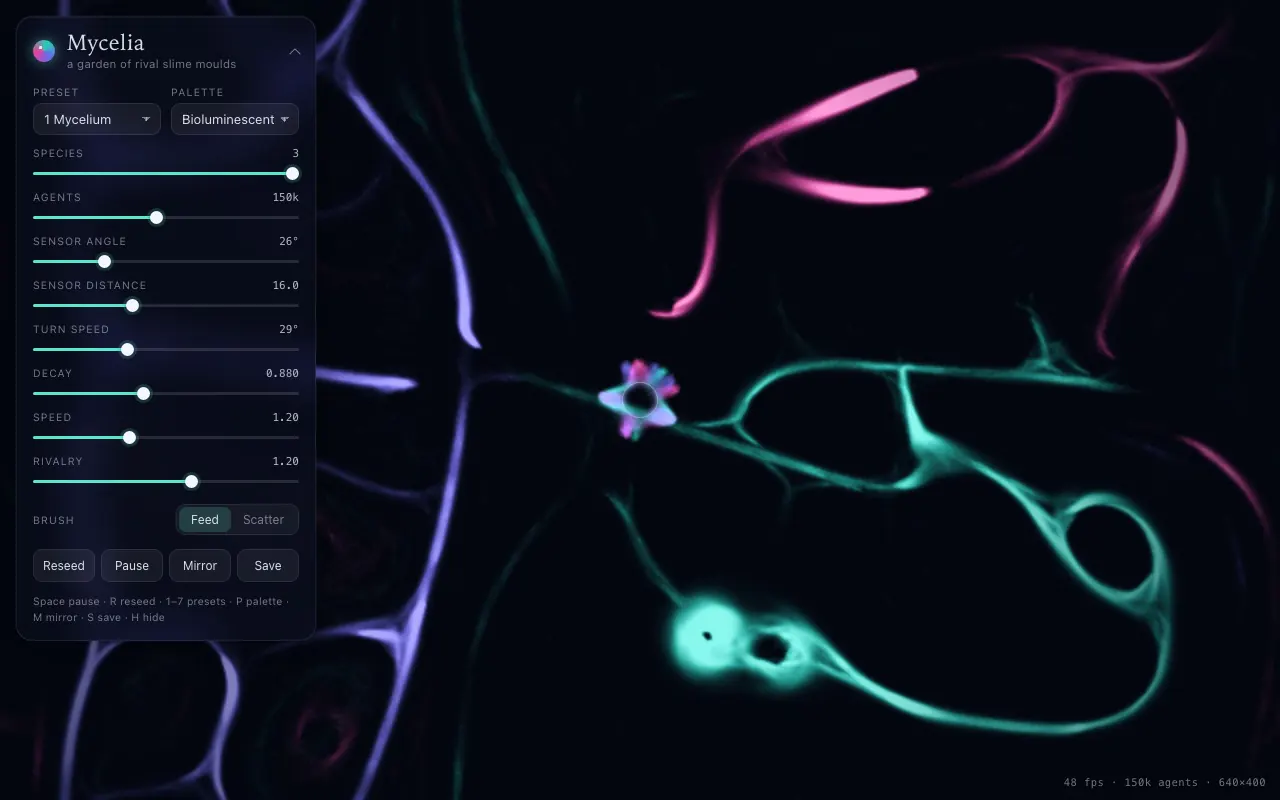
What each page does, by its own run’s report (the agent counts are the runs’ own figures):
- A, Campo de flujo (Spanish for “flow field”): seeded simplex noise, five palettes and a help panel. The page, its spec and its commits are in Spanish.
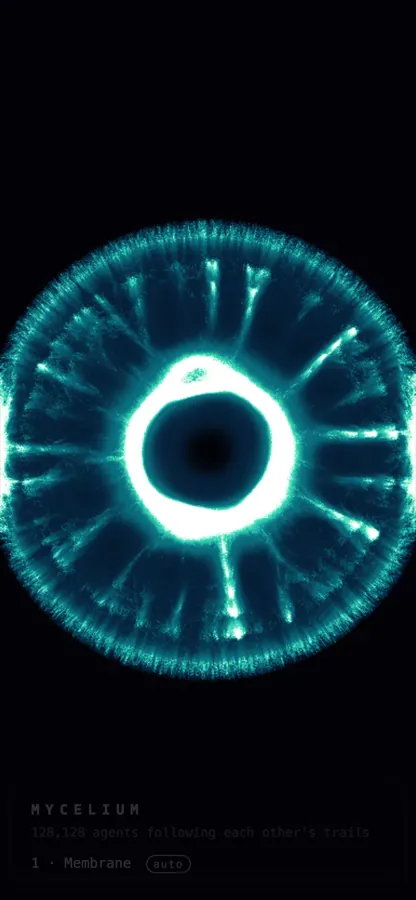
- B, Mycelium: up to about 250k agents, seven behaviors on keys 1–7, six palettes, and an autopilot that starts after 12 seconds without input.
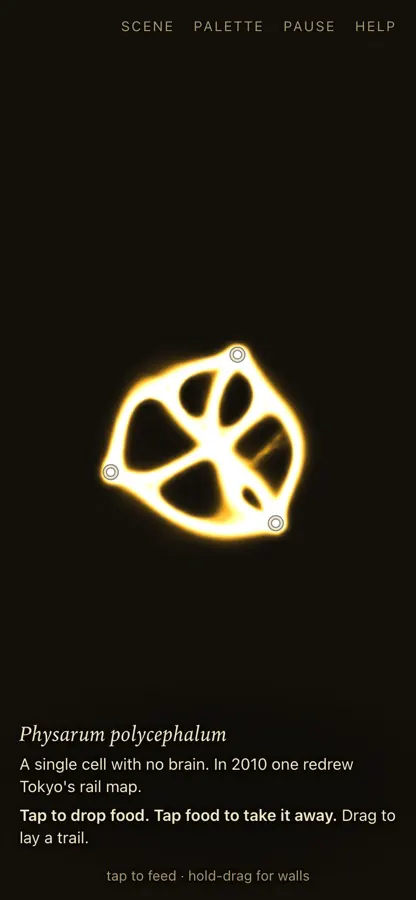
- C, Physarum: a slime mold you can feed: more than 100,000 agents and five scenes. Its Tokyo 2010 scene puts food on 22 real Greater Tokyo station coordinates, after Tero et al. (2010), and the
mkey overlays the minimum spanning tree between the food points. - D, Physarum: three species of living light: about 100k agents in three species that steer toward their own trail and away from the others’, with five presets.
- E2, Physarum Transit: WebGL2 with up to about 1M agents and a Canvas2D fallback. You place and drag stations, and the network reroutes between them.
- F, Mycelia: up to about 150k agents in one to three species, seven presets and a panel of sliders for every parameter.
Cost and time
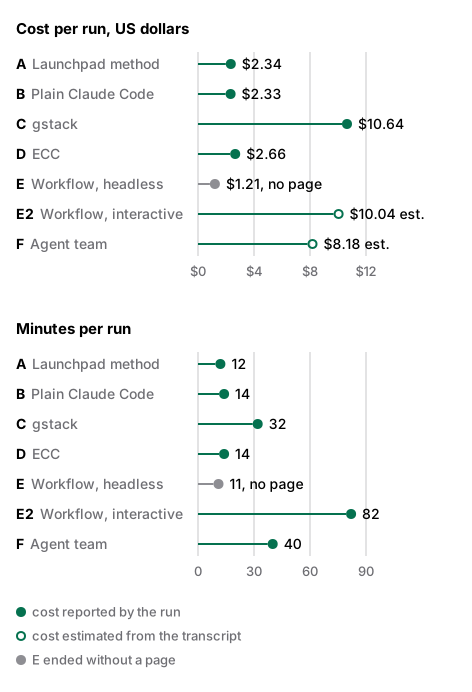
A, B and D cost $2.34, $2.33 and $2.66. C, E2 and F cost $10.64, $10.04 and $8.18, so the most expensive page cost more than four times the cheapest. The three cheaper runs were also the three shorter ones: 12 to 14 minutes for A, B and D, against 32 to 82 for C, F and E2. Since all six pages worked, the extra spend paid for review and polish. E spent $1.21 in 11 minutes and shipped nothing.
How the runs worked
Tool calls ranged from 6 for E to 234 for E2. The more interesting split is between looking and testing. B and E2 tuned their pages visually: they read 38 and 84 screenshots and kept no test files. A wrote 4 test files and read no screenshots at all. In its third coder session A couldn’t start Chrome inside the sandbox, so it checked the page’s behavior with a simulated DOM in Node; in its fourth session Chromium started and A wrote a Playwright smoke suite, but it still never read a screenshot of its page.
A also made no parallel batches of tool calls. Launchpad’s coder, initializer and fixer prompts state that the runtime emits exactly one tool call per turn, a figure measured at 414 of 414 turns during Launchpad’s own runs, and A followed that line. Launchpad’s docs have since corrected the reading behind it: parallel tool use is on by default, and a trace of two Launchpad sessions found that 22 of their 24 tool calls were stateful Bash, Edit or Write calls that depended on the call before, so the work had little to batch. The prompts still carry the earlier sentence, and the bake-off ran them unchanged. B, with no prompts at all, made 12 batches.
What the tests guarded
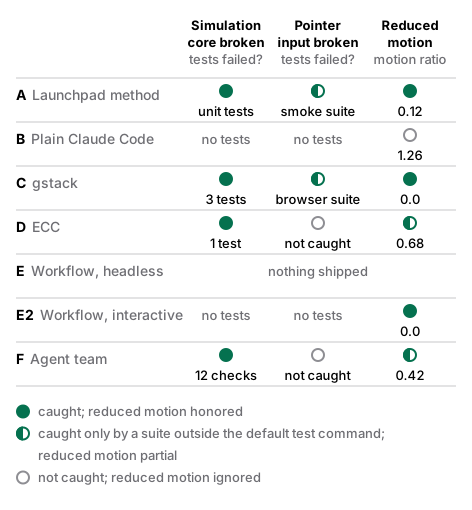
All four runs with a test suite caught a broken simulation core. A’s unit tests failed, as did 3 tests in C, 1 test in D and 12 checks in F. B and E2 kept no tests, so the break-check had nothing to run.
Broken pointer input is where the suites differed. D’s and F’s suites stayed green. A’s and C’s failed, and in both cases the failing checks sat outside the default test command:
- A’s check is in a Playwright smoke suite that runs under
npm run test:smoke. A’snpm testand its CI command both skipped it. - C’s is 4 checks of a 48-check browser suite that runs under
npm run qaand needs aPLAYWRIGHT=path and a server on port 8765, neither of which the repository declares. C’snpm testruns 24 node tests.
So in none of the six repositories would the default test command, where one exists, fail with pointer input disconnected. The repository’s write-up also records one test named “drag changes the trail” that still passed with dragging disconnected.
Reduced motion
A, C and E2 honored reduced motion, with ratios of 0.12, 0.0 and 0.0; E2 reached 0.0 after a warm-up. D slowed to 0.68 and said so, since its report states that prefers-reduced-motion halves the simulation rate. F slowed to 0.42 while its report says that “reduced motion is respected”. B moved more with the setting than without it, at 1.26. Its code has no prefers-reduced-motion handling, and its report doesn’t claim any.
What review found
The setups with a reviewer in a fresh context found bugs that their builders had missed:
- C’s
/reviewsubagent found 15 issues, and C fixed 14. By C’s report, the worst were that touch users with reduced motion were left on a paused page and that touch users couldn’t change scenes at all. - D’s
code-reviewerandtypescript-revieweragents reported no critical or high issues, and D fixed all the medium findings and most of the low ones. Among the fixes were canvas-relative pointer mapping and a resize that now re-grids the running simulation in place; before the fix, a resize restarted the simulation. - E2’s three parallel reviewers reported 10 confirmed findings (4 medium, 6 low), among them a vulgar station name that its name generator could produce.
- F’s testing teammate filed 3 bugs, one of them that touch screens had no way to repel.
A had no review step.
What it said about Launchpad’s prompts
The repository’s write-up calls A “the cheapest fully audited run”: it cost $2.34, and B, at $2.33, kept no tests. A’s spec cited evidence for each checklist item together with the commit that did it, and A left its last item open for a person: a visual and performance review, with a target of at least 50 FPS at the default density on an ordinary laptop. It marked what it hadn’t verified and claimed nothing beyond it.
The same run exposed four problems in the prompts:
- The line about one tool call per turn kept A at 0 parallel batches, against 12 for plain Claude Code. On Launchpad’s own sequential work the same line cost little, as
docs/AGENT-TOPOLOGY.mdrecords. - The prompts carried Launchpad’s own details into a brand-new project. A’s spec has
tenant: launchpadin its frontmatter, and the spec, four of its five commit messages and the page are in Spanish, although the brief was in English. Launchpad’s spec drafter, initializer and fixer prompts require Spanish prose. - There was no review step, so nothing in A’s run checked the builder’s claims.
- A’s CI command skipped the browser suite, which was the only suite that caught broken pointer input.
These results are cited in the Proof of Work model that I drew from Launchpad’s defect record. The test gate there is the union of every type of test (compile, unit, browser and journey tests), a reviewer in a fresh context checks the author’s claims at each milestone, and prompt lines that describe the agent runtime are deleted. The Launchpad essay covers that model.
Discussion
With one model under every setup, every page that shipped worked, and five of the six chose the same idea. The setup changed what a run cost, how it worked and what its tests covered. My reading is that the model set the ceiling for quality, and the extra spend in C, E2 and F bought review and polish on pages that already worked.
The test results are the finding I’d act on first. Every suite guarded the algorithm, which is the part that unit tests reach easily. Pointer input needs a browser, and in the two runs that tested it, the browser checks sat outside the command a developer runs by default. The break-checks are the only measure here that showed this.
Looking and testing also behaved as separate skills. The runs that read dozens of screenshots kept no tests, and A, which wrote 4 test files, never looked at its page. Review in a fresh context found bugs that the builders had missed, such as the paused page for touch users in C and the resize that restarted the simulation in D.
The headless runs showed two limits of claude -p: a workflow it starts stops when the session ends, which is why E built nothing and still exited 0, and agent teams don’t form under it at all. The write-up also states that auto mode silently reverts to default permissions on Haiku; no run in this bake-off used Haiku, so that observation comes from outside these seven runs.
Limitations
- Each setup ran once, on one brief, on one day. A difference between two setups can be variance between runs.
- The minutes are approximate, and the costs of E2 and F are estimates.
- The write-up counts as test files the committed files under a
test/,tests/or__tests__/directory or named*.test.*or*.spec.*. B and E2 shipped browser smoke scripts outside that pattern (tools/check.mjsandtools/verify.mjs) that need a separate install of a browser driver, so the counts don’t treat them as test files. The rule counts files by path: A’s 4 include its two smoke tests, which itsnpm testdoesn’t run, and F’s 4 include itstests/package.jsonand lock file. The write-up doesn’t define how parallel batches were counted. - I wrote the brief, chose the measures and measured every run, and A is my own method.
- The transcripts, the run reports and the measurement data aren’t public. The write-up in the Launchpad repository and the six pages hosted here are.
Reproduce it
The sandbox, the transcripts and the scripts that measured the seven runs aren’t in a public repository, so the experiment itself can’t be re-run from a clone. Two parts can.
The pages
Each page opens at its live link above. Five of the pages load their scripts as ES modules by relative path, so a local copy needs a static server such as python3 -m http.server. B loads a classic script, so it is the only page that can open directly from disk.
Re-run on 2026-10-16: the six live copies were served with Python’s http.server and each one was loaded in headless Chrome, driven by puppeteer-core, at 1280×800 and at 390×844 with touch. After a 4-second wait, animation frames were counted for 2 seconds. All 12 loads had 0 console errors, 0 warnings, 0 page errors, 0 failed requests, 0 responses with status 400 or above, and 0 requests to another origin, and they animated at 52–60.5 frames per second. That rate is the browser’s animation-frame rate on the machine that ran the probe and says nothing about the speed of each simulation.
A break-check
scripts/break-check.sh from the Launchpad repository needs bash and python3, and it runs on any project whose test command prints TAP. This example has one guarded line and one unguarded line:
git clone https://github.com/JCastrejonE/launchpad.git
mkdir demo && cd demo
printf 'export const add = (a, b) => a + b;\nexport const scale = (a, k) => a * k;\n' > sum.js
cat > sum.test.mjs <<'EOF'
import test from 'node:test';
import assert from 'node:assert/strict';
import { add } from './sum.js';
test('add', () => assert.equal(add(2, 3), 5));
EOF
bash ../launchpad/scripts/break-check.sh --file sum.js --from 'a + b' --to 'a - b' \
  --cmd 'node --test --test-reporter=tap'
bash ../launchpad/scripts/break-check.sh --file sum.js --from 'a * k' --to 'a / k' \
  --cmd 'node --test --test-reporter=tap'
In the re-run of 2026-10-16 (macOS, Node 24.21.0), the first command exited 0 with GUARD IS REAL: 1 failing test(s) when sum.js was mutated. and the second exited 1 with NOT GUARDED: nothing failed when sum.js was mutated. The script counts lines that start with not ok, so the --test-reporter=tap flag was required on Node 24.21.0; without it the script exits 2 and reports that the suite didn’t run.
References
- Juan Carlos Castrejón Estrada. “Setup bake-off.”
docs/SETUP-BAKEOFF.md, lines 1–46, in the launchpad repository. - “Proof of Work.”
docs/PROOF-OF-WORK.md, lines 100, 112 and 124, same repository. README.md, lines 5, 67–68 and 74, same repository.scripts/break-check.sh, lines 1–33 (usage and exit codes), same repository.agents/coder.mdline 75,agents/initializer.mdline 39 andagents/fixer.mdline 25 (the one-tool-call-per-turn line);agents/spec-drafter.mdline 81,agents/initializer.mdline 98 andagents/fixer.mdline 59 (the Spanish-prose rule), same repository.docs/AGENT-TOPOLOGY.md, lines 193–235 (“Batching: available, on by default, and nothing to spend it on”), anddocs/AGENT-PERFORMANCE.md, line 44 (the 414 turns), same repository.- Run records of the bake-off, not published: A’s spec (
plan.md, lines 6, 142 and 146–150) and commit list; the reports of B, C, D, E2 and F; D’s question log, item 4; the workflow files of E (lines 4–10) and E2 (lines 4–11); and the commit lists of all seven runs. - Measurement data of the bake-off, not published: cost, minutes, process counts, guard results and reduced-motion ratio for each run.
- Re-runs of 2026-10-16, described in “Reproduce it”: the live-page probe and the break-check example.
- J. Jones. “Characteristics of pattern formation and evolution in approximations of Physarum transport networks.” Artificial Life 16(2), 2010. Cited by the reports of B, D, E2 and F.
- A. Tero et al. Science 327(5964), 2010: the Physarum experiment that reproduced the Greater Tokyo rail network. Cited by C’s report for its Tokyo scene.